Waste Management Market Report - UK 2021-2025 - AMA Research

Waste Management Market Report – UK 2021-2025

PDF icon

Available as an Instant Download PDF

The 11th edition of the Waste Management Market Report UK has been published by AMA Research. The report addresses the management of controlled waste arising from the municipal, commercial & industrial, construction & demolition sectors.

£1,599.00 Exc. VAT

The 11th edition of the Waste Management Market Report UK 2021-2025 has been published by AMA Research. The report represents an informed and up-to-date detailed review of the private waste management contracting sector covering:- household, commercial & industrial, construction & demolition and hazardous waste arisings; the collection, treatment and disposal thereof.

Key issues covered in the report:

  • An assessment of the effect of Covid-19 on the market in the short to medium term.
  • The significance of the UK’s departure from the EU and the substitutes for EU Directives; expansion of extended producer responsibility programmes; Contracts for Difference replacing renewable energy subsidy schemes
  • Growth in privately funded waste management infrastructure.

Areas of particular interest include:

  • Recent and forecast major expansion of ‘mass burn’ energy-from waste incineration capacity; growth in anerobic digestion capacity; steady growth in gasification infrastructure
  • Growth of ‘insourcing’ of waste collection services among local authorities.
  • Substantial consolidation within the waste management contracting sector.

Some of the companies included:

MVV, FCC, Urbaser, Covanta, Cyclerval (a subsidiary of TIRU), Indaver, Norican Group, Veolia ES, Viridor, Biffa UK, Beauparc Group, Enva Group, Future Industrial Services, Reconomy, Red Industries, B&M Waste Services, Amey, Kier Group, Enva, Tradebe Environmental Services, GreenTech Distribution, SRCL, Cleansing Service Group, Cory Riverside Energy, Palm Recycling, Countrystyle Recycling, Powerday and more.


Market Overview

  • UK waste management contracting industry – market definition, size and service mix. Performance and changes in market in recent years; trends 2015-2020 and forecasts 2021- 2025.

Service Sectors

  • Municipal non-hazardous waste management; collection, recycling, landfill and incineration.
  • Commercial & industrial non-hazardous waste management
  • Construction & demolition non-hazardous waste management
  • Hazardous waste management
  • Waste treatment and disposal infrastructure: ‘mass burn’ energy from waste incineration, gasification, anaerobic digestion, mechanical biological treatment and dry recycling Landfill sites.

Market Prospects

  • Longer-term-post-EU prospects largely dependent on passing the Environment Bill into legislation, which promises enhanced producer responsibility and working towards the ‘circular economy.
  • Over the short-term, legislation derived from EU Directives will still be applicable.
  • Decreasing landfill non-hazardous capacity is creating the urgent need to increase recycling and energy recovery capacity. Since 2000, the main growth driver has been PFI funding of municipal waste treatment facilities. Over the next 10-15 years it will be private joint ventures funding merchant facilities handling non-domestic waste that will be the engine for growth.

Supply and Distribution

Since 2018, there have been many acquisitions resulting in further market consolidation in the waste management contracting sector. Among the fastest growing of the ‘newer’ larger companies are Enva Group, Urbaser UK, Recycling Lives, Reconomy and Beaupark UK.

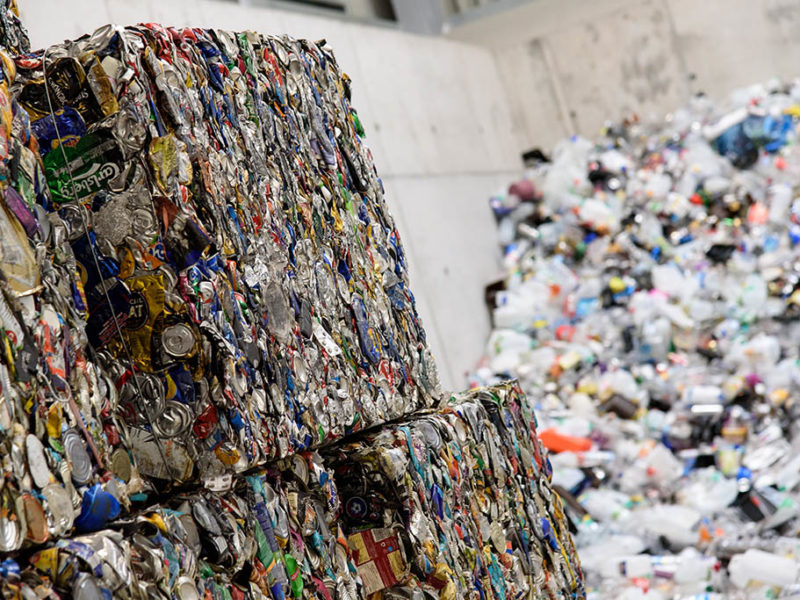
The waste management market continues to evolve quickly in part driven by subject to regular changes in legislation and definition. This 11th edition includes activities under the general SIC 2007 code 38.30, ‘Material Recovery’ because waste management companies are increasingly diversifying away from traditional waste management functions – such as general refuse collection and landfill disposal – towards recycling, from collection to waste segregation, sorting and baling to producing intermediate products such as glass cullet, plastic flakes.

This report includes an analysis of the industry with an assessment of future prospects; a review of waste arisings by origin, material type and end product; a review of current and prospective legislation; and an assessment of collection, disposal and recovery issues. Along with a detailed examination of government strategies, initiatives and funds that impact upon the waste management industry.

For the UK waste management contracting industry, growth in contractors’ output was marginal, reaching £9.8bn in 2019. Anecdotal evidence suggests the pandemic has had a substantial effect on non-household waste arisings and hence demand for waste management services. To some extent, this has been offset by an increase in domestic waste arisings. For 2020, it is estimated, contracting output will possibly have fallen to around £9.3bn.

CONTENTS

RESEARCH SERVICES OFFERED BY AMA RESEARCH 3
1. INTRODUCTION 9
1.1 MARKET DEFINITION 9
1.2 METHODOLOGY 10
1.3 GLOSSARY OF TERMS AND ABBREVIATIONS 11
2. SUMMARY 13
3. WASTE MANAGEMENT CONTRACTING MARKET 16
3.1 DEFINITIONS 16
3.2 MARKET SIZE & TRENDS 16
3.2.1 Overview of solid waste management services expenditure 16
3.2.2 Market size, trends and forecasts 18
3.3 KEY MARKET INFLUENCES 22
3.3.1 Waste arisings 22
3.3.2 Legislation and regulations 24
3.3.3 Landfill Tax and Gate Fees 27
3.3.4 Renewable Energy Subsidies 28
3.3.5 Demand for recovered materials 30
3.3.6 Trend towards local authority insourcing 33
4. WASTE ARISINGS 35
4.1 OVERVIEW 35
4.2 NON-HAZARDOUS CONSTRUCTION, DEMOLITION AND EXCAVATION WASTE ARISINGS 36
4.3 NON-HAZARDOUS COMMERCIAL AND INDUSTRIAL WASTE ARISINGS 37
4.4 HOUSEHOLD WASTE ARISINGS 39
4.5 HAZARDOUS WASTE ARISINGS 40
5. WASTE MANAGEMENT SERVICES 42
5.1 INTRODUCTION 42
5.2 HOUSEHOLD WASTE MANAGEMENT 42
5.2.1 Overview 42
5.2.2 MSW Collection 44
5.2.3 Household waste treatment and disposal 46
5.3 COMMERCIAL AND INDUSTRIAL WASTE MANAGEMENT 47
5.4 CONSTRUCTION, DEMOLITION AND EXCAVATION WASTE TREATMENT AND DISPOSAL 48
5.5 HAZARDOUS WASTE MANAGEMENT 49
6 WASTE TREATMENT AND DISPOSAL INFRASTRUCTURE 51
6.1 ENERGY FROM WASTE PLANTS 51
6.1.1 Overview 51
6.1.2 Conventional EfW Incinerators 52
6.1.3 Advanced Thermal Treatment Plants 54
6.1.4 Anaerobic digestion plants 57
6.2 DRY RECYCLING 59
6.2.1 Materials recycling facilities (MRFs) 59
6.2.2 Mechanical biological treatment facilities 60
6.3 LANDFILL SITES 62
7. INDUSTRY STRUCTURE AND SUPPLY 64
7.1 INDUSTRY SIZE 64
7.2 MERGERS AND ACQUISITIONS 65
7.3 LEADING WASTE MANAGEMENT AND RECYCLING CONTRACTORS 69
7.3.1 Veolia Environmental Services 69
7.3.2 Biffa Group Holdings 70
7.3.3 Viridor Waste 72
7.3.4 Suez Recycling and Recovery UK 74
7.3.5 FCC Environment (UK) 74
7.3.6 Reconomy UK 75
7.3.7 Enva Group 76
7.3.8 Recycling Lives 77
7.3.9 Renewi UK Services 78
7.3.10 DS Smith Recycling 79
7.3.11 Beauparc UK 79
7.3.12 Ward Recycling 80
7.3.13 Grundon Waste Management 81
7.3.14 Tradebe Environmental Services 81
7.3.15 Urbaser 82
7.3.16 Augean plc 83
7.3.17 Enovert Management 84
7.3.18 GreenTech Distribution Plc 84
7.3.19 SRCL 85
7.3.20 Cory Riverside Energy 85
7.3.21 Cleansing Service Group 85
7.3.22 Palm Recycling 86
7.3.23 LondonEnergy 86
7.3.24 Countrystyle Recycling 87
7.3.25 Powerday 87
APPENDICES 88
APPENDIX A: ECONOMIC ENVIRONMENT 88
A.1 OVERVIEW AND OUTLOOK 88
A.2 GDP 88
A.3 INFLATION & INTEREST RATES 90
A.4 EMPLOYMENT & WAGES 91
A.5 HOUSEHOLD CONSUMPTION 92
A.6 STERLING 93

TABLES AND CHARTS

TABLE 1: UK MARKET FOR CONTROLLED WASTE MANAGEMENT CONTRACTING SERVICES BY VALUE (£ BILLION) 2015 –2024 13
CHART 2: PUBLIC SECTOR EXPENDITURE ON SOLID WASTE MANAGEMENT SERVICES 17
CHART 3: UK WASTE MANAGEMENT CONTRACTING BY SERVICE TYPE BY VALUE 2019/20 18
CHART 4: UK MARKET FOR CONTROLLED WASTE MANAGEMENT CONTRACTING SERVICES BY VALUE (£ BILLION) 2015 –2025 18
CHART 5: UK CONTROLLED WASTE ARISINGS BY MAIN WASTE STREAM, 2018 AND 2016 23
CHART 6: ANNUAL PACKAGING RECYCLING TARGETS BY MATERIAL TYPE 2018-2022 27
TABLE 7: MEDIAN GATE FEES COMPARISON (£/TONNE) BY METHOD OF DISPOSAL AND TREATMENT 2013- 2018 28
CHART 8: UK TRENDS IN NUMBERS OF ROCS ISSUED TO ACCREDITED FUELLED RENEWABLE ENERGY PLANTS 2011/12 -2018/19 29
TABLE 9: UK RDF EXPORTS (THOUSAND TONNES) 2013 -2020 33
CHART 10: UK CONTROLLED WASTE ARISINGS BY MAIN WASTE STREAM, 2018 35
TABLE 11: UK NON-HAZARDOUS CONSTRUCTION AND DEMOLITION WASTE ARISINGS BY MATERIAL (%) 2018 36
TABLE 12: UK NON-HAZARDOUS CONSTRUCTION AND DEMOLITION WASTE ARISINGS (MILLION TONNES), 2013-2018 37
CHART 13: UK NON-HAZARDOUS COMMERCIAL AND INDUSTRIAL WASTE ARISINGS (MILLION TONNES) 2013-2018 38
CHART: 14: HOUSEHOLD WASTE ARISINGS IN THE UK AND THE FOUR HOME NATIONS (MILLION TONNES) 2012-2018 39
CHART: 15 COMPOSITION OF HOUSEHOLD WASTE IN ENGLAND 2018 40
CHART 16: ENGLAND HAZARDOUS WASTE ARISINGS 2012-2019 41
CHART 17: UK WASTE TREATMENT AND DISPOSAL SERVICES MIX BY TYPE BY VALUE 2019 42
CHART 18: ENGLAND LOCAL AUTHORITIES ENVIRONMENTAL SERVICES NET REVENUE AND CAPITAL BUDGETS (£000) 2012/13 -2020/21 43
CHART 19: ENGLAND LOCAL AUTHORITIES WASTE MANAGEMENT REVENUE BUDGETS BY SERVICE 44
TABLE 20: HOUSEHOLD WASTE COLLECTION IN ENGLAND BY TYPE (000 TONNES), 2014/15- 2018/19 45
CHART 21: UK WFH DISPOSAL ROUTES (‘000 TONNES) 2012 – 2018 46
CHART 22: UK MSW AND BMW TONNAGES & % OF 1995 TARGET BASELINE 2012-2018 47
CHART 23: ESTIMATES OF THE MIX BETWEEN CIW TREATMENT AND DISPOSAL METHODS BY INPUT (TONNAGES) 48
TABLE 24: UK RECYCLED CONSTRUCTION AND DEMOLITION WASTE AND ASPHALT PLANINGS BY VOLUME 2015 – 2018 49
CHART 25: TREATMENT AND DISPOSAL OF HAZARDOUS WASTE IN ENGLAND 2019 50
CHART 26: GROWTH IN ENERGY FROM WASTE CAPACITY – BY PERMITTED INPUT CAPACITY 2012-2020 52
TABLE 27: 25 LARGEST CONVENTIONAL EFW FACILITIES IN THE UK,Q1 2021 53
TABLE 28: LARGEST EFW FACILITIES (CAPACITY OF 200+ KTPA) IN THE UK UNDER CONSTRUCTION (OR WITH APPROVAL TO BECOME OPERATIONAL) BY 2025 54
TABLE 29: LARGER GASIFICATION PLANTS IN THE UK, OPERATIONAL AT Q1 2021 56
TABLE 30: UPCOMING GASIFICATION PLANTS SUPPORTED BY CONTRACTS FOR DIFFERENCE FUNDING 56
CHART 31: UK ROLL OUT OF AD PLANTS UNDER FIT BY YEAR COMMISSIONED, 2020-2019 58
CHART 32: UK ANNUAL NEW MBT NET CAPACITY BECOMING OPERATIONAL (‘000 TONNES) PRE-2007-2020 61
TABLE 33: LARGEST MBT FACILITIES IN THE UK,Q1 2021 61
CHART 34: ENGLAND TOTAL WASTE SENT TO LANDFILL (MILLION TONNES) 2012-2019 62
CHART 35: AVAILABLE LANDFILL CAPACITY IN ENGLAND AT 2020 63
TABLE 36: UK WASTE MANAGEMENT INDUSTRY BY EMPLOYEE COUNT, MARCH 2020 64
TABLE 37: UK WASTE MANAGEMENT INDUSTRY BUSINESSES, BY TURNOVER (£000S), AT MARCH 2020 65
TABLE 38: LEADING 25 WASTE MANAGEMENT CONTRACTORS IN UK, BY ANNUAL TURNOVER 68
CHART A1: GVA CHAINED VOLUME MEASURES, 2015-2020, KEY CONSTITUENT ELEMENTS 90
CHART A2: CPI INFLATION AND BANK OF ENGLAND BASE RATE, 2008-2023 91
CHART A3: AVERAGE WEEKLY EARNINGS DATA – GB – TOTAL PAY – 2014-2019 (SEASONALLY ADJUSTED) 92
CHART A4: DI PER CAPITA & SAVINGS RATIO AT CURRENT PRICES 2008-2023 92
CHART A5: EXCHANGE RATE FLUCTUATIONS 2015-2019, STERLING TO THE DOLLAR AND THE EURO, SPOT RATES 93

Paired reports

Paired Report Discount

Save £250 for every two reports you buy

Discount applied in basket

>>
>>
>>
>>

Frequently bought together

This item: Waste Management Market Report - UK 2021-2025
£1,599.00 Exc. VAT
£1,599.00 Exc. VAT
£1,599.00 Exc. VAT
£1,599.00 Exc. VAT

Trusted by industry leaders

For more detailed requests speak to our research experts directly


    Research you can depend on

    Our reports go deeper to give you the insights needed to make your next strategic move.

    • Detailed assessment of the market – analysis of the market structure and recent developments within the market.
    • Market prospects up to 4 years – market value, opportunities, impact of Covid-19, Brexit etc.
    • Detailed information – market size, influences, market factors and key players.
    • Analysis by product group – market size, product mix, sector trends etc.
    AMA logo

    01242 235724
    (Office hours: 8:30am – 5:00pm)
    sales@amaresearch.co.uk

    AMA Research, a Barbour ABI Limited Company
    5th Floor
    133 Houndsditch
    London
    EC3A 7BX

    What's Included?

    Here’s an overview of what’s included in our market research reports:
    • Market Definition
    • Market Prospects
    • Market Size
    • 5 year Forecast
    • Suppliers
    • Trends
    • 15 minute session with editor
    PDF icon

    Available as an Instant Download PDF

    Microsoft Word logo

    MS Word version available interactive portal

    Ask us anything

    Our market research experts are on hand to answer your questions and help you choose the right reports for your business needs.


    Call us on 01242 235724 or request a callback for a free consultation with an AMA Research Expert


      By using this form you agree that your data will be processed and protected in line with our Privacy Policy.

      Upcoming Report

      Please notify me when this upcoming report becomes available.

        Get in touch with our team

        If you have a question regarding any of our publications or subscriptions, or would like a quote for a bespoke research project, you can contact us by completing the form below.